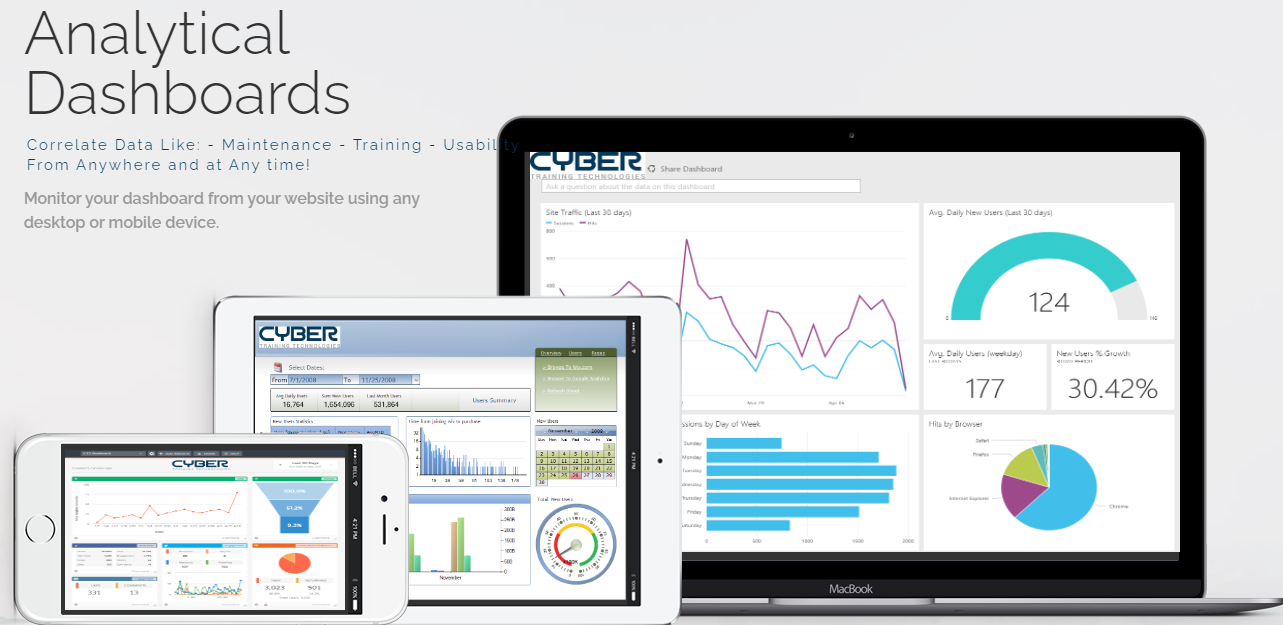
Dashboard Development: Let us develop an analytical dashboard to correlate and compare the vital data points you already collect. This dashboard will provide a visual (graphs or charts) display of these correlations and provide management the potential cost savings.
USE CASES FOR DEVELOPING AN ANALYTICAL DASHBOARD
Maintenance Issues?
Do you have a system with several components? Can you correlate data such as “Cost to Repair”, “Components”, “Subcomponents”, and “Locations”? A graph or chart will be able to show the highest levels of costs or repairs by components. These data points can provide management a unique look at potential cost savings by redesigning the failing component, rather than eliminating the entire system.
Training Issues?
Have you a concern with the training products that are being used by your company? We can develop an analytical dashboard that will help display and correlate the results of your training. No matter what type of training the company is using: Facilitated Training (FT), Interactive Multimedia Instruction (IMI), Hands-On Training, or Instructional Video, let us digitize, correlate, and display your training. This will help you depict the problem areas in your training products and will save you money.
Utilization Issues?
Have you a concern with the use of your equipment because it keeps failing? Let us customize the dashboard to determine if there are any correlations between training, maintenance, or utilization of the equipment your employees are using.
Marketing / Sales Issues?
Have you been spending money on newly developed websites or advertisement materials that are not helping your revenue? Let us develop an analytical dashboard that will help your management team determine where there are cost savings.